Poisson Distribution Explained
Poisson Distribution outputs the probability of a sequence of events happening in a fixed time interval.
Poisson Distribution Explained Read More »
Poisson Distribution outputs the probability of a sequence of events happening in a fixed time interval.
Poisson Distribution Explained Read More »
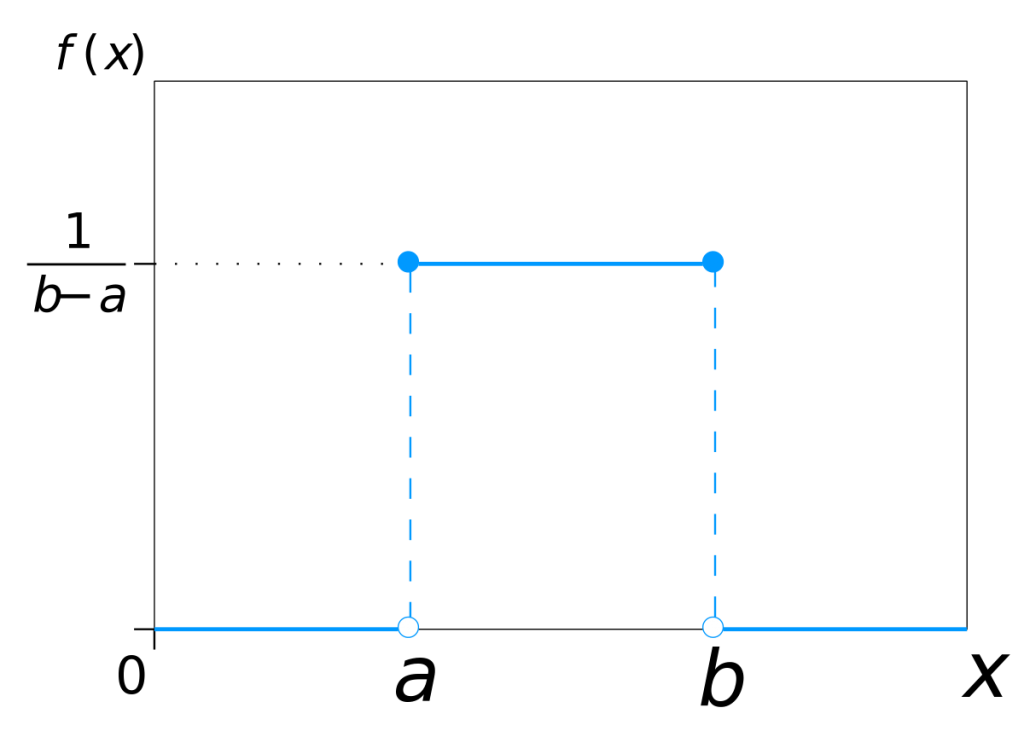
In a Uniform Distribution Probability Density Function (PDF) is same for all the possible X values. Sometimes this is called a Rectangular Distribution. There are two (2) parameters in this distribution, a minimum (A) and a maximum (B)
Uniform Probability Distribution Read More »
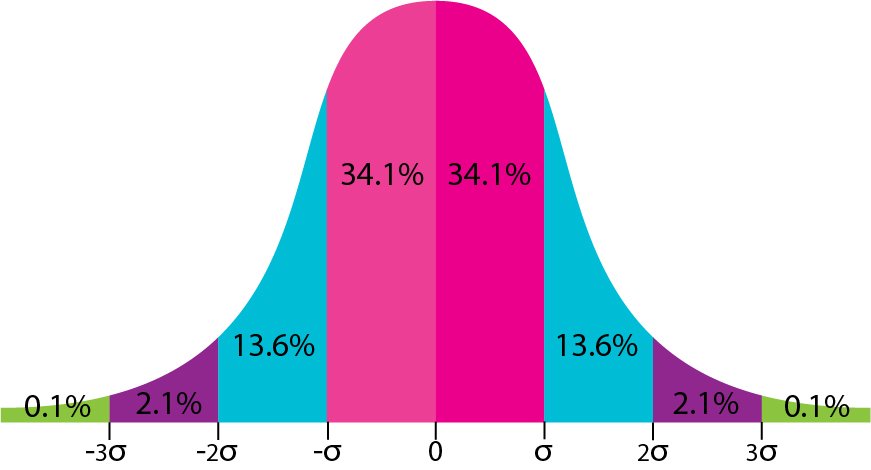
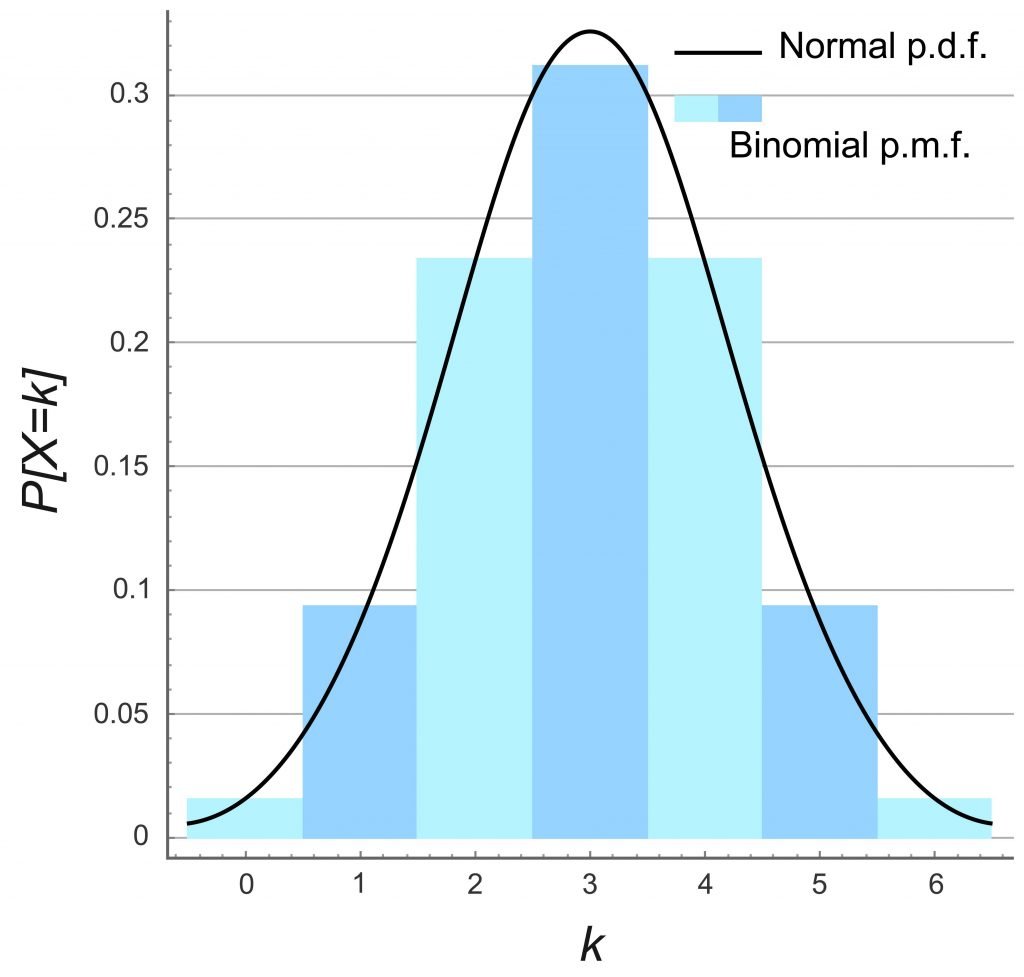
Normal Distribution is the most important probability distribution in Probability and Statistics. A normal probability distribution is a bell shaped curve. Many numerical populations have distributions that can be fit very closely by an appropriate normal curve.
Normal Distribution, Z Scores and Standardization Explained Read More »
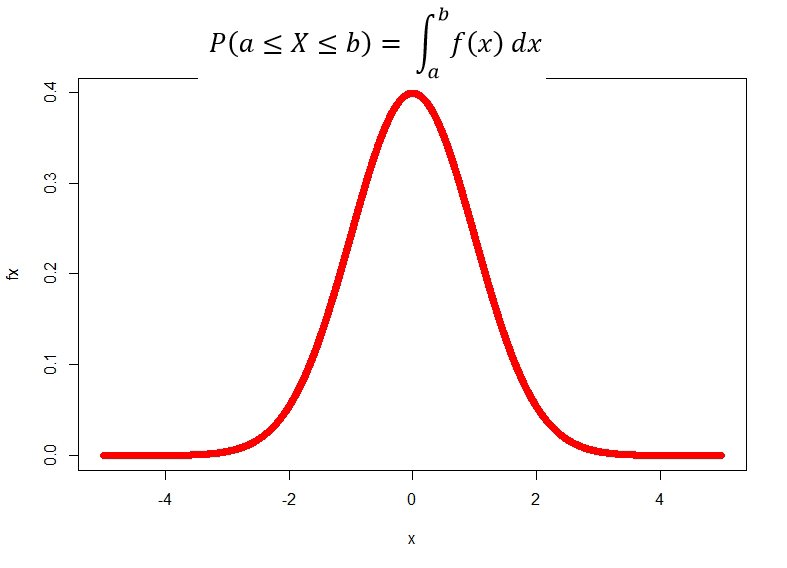
Earlier we used Probability Mass Function to describe how the total probability of 1 is distributed among the possible values of the Discrete Random Variable X.
Probability Density Function Read More »
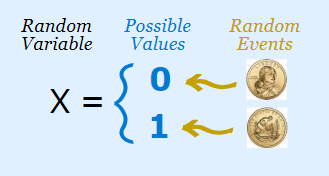
A Random Variable is any rule that maps (links) a number with each outcome in sample space S. Mathematically, random variable is a function with Sample Space as the domain. It’s range is the set of Real Numbers.
Random Variables in Statistics Read More »
In the Negative Binomial Distribution, we are interested in the number of Failures in n number of trials. This is why the prefix “Negative” is there. When we are interested only in finding number of trials that is required for a single success, we called it a Geometric Distribution.
Negative Binomial Distribution Read More »
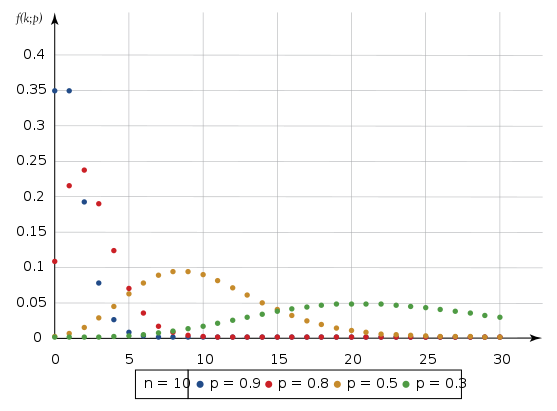
Binomial Distribution is used to find probabilities related to Dichotomous Population. It can be applied to a Binomial Experiment where it can result in only two outcomes. Success or Failure. In Binomial Experiments, we are interested in the number of Successes.
Binomial Probability Distribution Read More »

Probability Mass Function (PMF) of X says how the total probability of 1 is distributed (allocated to) among the various possible X values.
Probability Mass Function Read More »
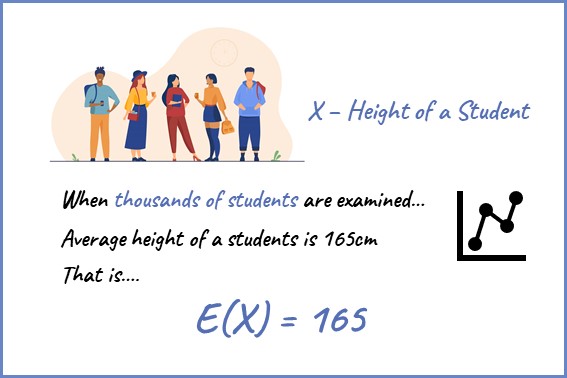
Expected Value is the average value we get for a certain Random Variable when we repeat an experiment a large number of times. It is the theoretical mean of a Random Variable. Expected Value is based on population data. Therefore it is a parameter.
Expected Value of a Random Variable Read More »