Skip to content
  • Home
  • Terms and Conditions
  • Privacy Policy
  • Sitemap
  • Contact Us

Statistics Tutorials

Statistics Tutorials

  • Home
  • Statistics
  • Blog
  • About Us
  • Contact Us
  • Toggle search form

Author: admin

Randomized Incomplete Block Design

Posted on June 2, 2022June 2, 2022 By admin No Comments on Randomized Incomplete Block Design
Randomized Incomplete Block Design

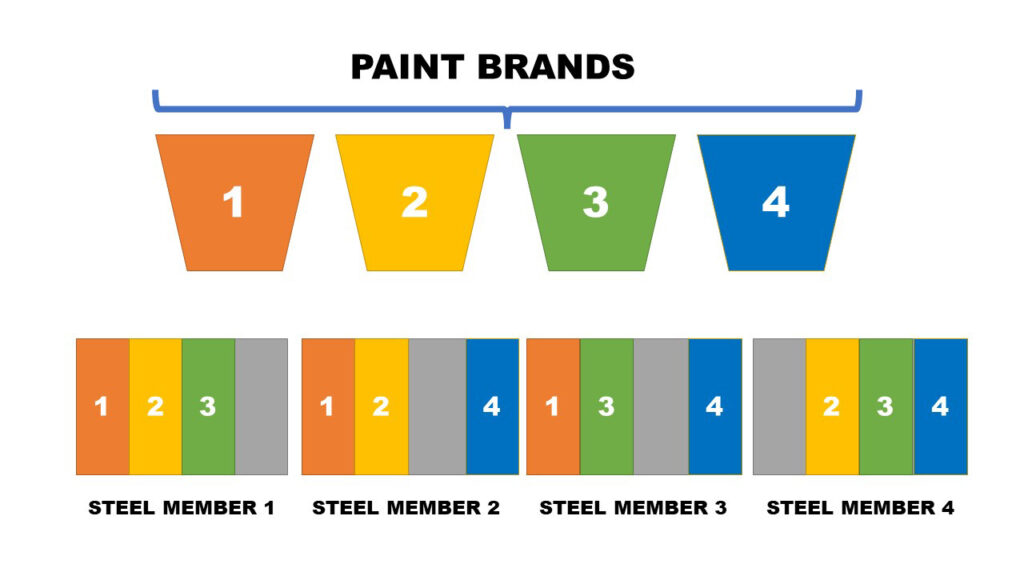
Introduction Usually when conducting experiments, all treatment combinations are assigned to all the blocks. Thus, they are called “complete” designs. But in the real world, this might not be the case always. Due to resource constraints and physical size of blocks, the experimenter is forced to use randomized block designs where every treatment is not…

Read More “Randomized Incomplete Block Design” »

DOE

Why do Statistical Data Analysis?

Posted on August 29, 2021August 29, 2021 By admin No Comments on Why do Statistical Data Analysis?
Why do Statistical Data Analysis?

Introduction Statistical Data Analysis or simply put “Data Analysis” is very common term these days. But what does this really mean? And most importantly, why should we do that? Well, as you all know, “Data is the new Oil” To get proper use of oil, we need to mine it from underground and purify it…

Read More “Why do Statistical Data Analysis?” »

R Programming

Classical Method of Time Series Analysis

Posted on May 23, 2021April 8, 2022 By admin No Comments on Classical Method of Time Series Analysis

Classical method of time series is done by decomposing a time series intro trend, seasonal, cyclic and irregular components. What is decomposing? The meaning of the word “decomposing” in Mathematics is breaking something into parts, that together are the same as original. For an example, we can decompose 664 like this; 664 –> 600 +…

Read More “Classical Method of Time Series Analysis” »

Time Series

Time Series Analysis

Posted on May 16, 2021May 16, 2021 By admin No Comments on Time Series Analysis
Time Series Analysis

Introduction Most of you have heard about the term Time Series Analysis if you have learned Statistics as a subject anywhere. We at datasciencelk, are bringing you a series of posts about Time Series Analysis in detail. So what actually is Time Series Analysis? Time Series Analysis is basically the study and forecasting of time…

Read More “Time Series Analysis” »

Statistics

Which software to use, Minitab, R or Python?

Posted on May 9, 2020December 28, 2021 By admin 5 Comments on Which software to use, Minitab, R or Python?
Which software to use, Minitab, R or Python?

Minitab is ideal for Statistical Analysis. R is great for complex statistical analysis. Python is ideal for Machine Learning and Data Science

Blog

Creating Box Plots in R ggplot2

Posted on April 26, 2020April 30, 2020 By admin 3 Comments on Creating Box Plots in R ggplot2
Creating Box Plots in R ggplot2

Box Plots are used to get a good visual idea about the distribution of data and spot outliers.

Data Science, R Programming

How to make a Histogram with R

Posted on April 22, 2020April 26, 2020 By admin No Comments on How to make a Histogram with R
How to make a Histogram with R

We can use histograms in R to visualize continuous variables. In a histogram, the area of each column is proportional to the frequency.

Data Science, R Programming

Correlation Coefficient Interpretation

Posted on April 20, 2020April 26, 2020 By admin No Comments on Correlation Coefficient Interpretation
Correlation Coefficient Interpretation

Introduction The correlation coefficient is used to measure the strength of the relationship between two variables. There are several types of correlation coefficients; Pearson Correlation Coefficient Spearman Rank Correlation Coefficient Kendall Rank Correlation Coefficient Pearson Correlation Coefficient Generally, when we say correlation coefficient, we actually mean Pearson’s Correlation Coefficient. This is used to measure the…

Read More “Correlation Coefficient Interpretation” »

General

Poisson Distribution Explained

Posted on April 19, 2020April 8, 2022 By admin No Comments on Poisson Distribution Explained

Poisson Distribution outputs the probability of a sequence of events happening in a fixed time interval.

Probability, Probability Distributions

Posts navigation

1 2 3 Next

Categories

  • Blog
  • Data Science
  • DOE
  • General
  • Probability
  • R Programming
  • Statistics
    • Probability Distributions
    • Regression Analysis
    • Time Series

Recent Posts

  • Randomized Incomplete Block Design
  • Why do Statistical Data Analysis?
  • Classical Method of Time Series Analysis
  • Time Series Analysis
  • Which software to use, Minitab, R or Python?

Tags

data cleaning (1) data visualization (1) Expected Value (2) Minitab (3) Multiple Linear Regression (3) Poisson (1) Probability (4) R (3) Random Variables (2) Regression Analysis (3) text analytics (1) TIme Series (1) wordcloud (1)

Recent Comments

  • admin on Which software to use, Minitab, R or Python?
  • Bunty Maskey on Which software to use, Minitab, R or Python?
  • Bunty Maskey on Which software to use, Minitab, R or Python?
  • admin on Which software to use, Minitab, R or Python?
  • Paul Alikado Sabuni on Which software to use, Minitab, R or Python?

Copyright © 2022 Statistics Tutorials.

Powered by PressBook WordPress theme

Terms and Conditions - Privacy Policy