
Introduction
As the field of data analysis continues to evolve, the choice of programming language plays a crucial role in the success of a data analyst. In 2023, Python and R are two prominent programming languages that are extensively used for data analysis. Each language has its own set of strengths and weaknesses, making it essential to consider various criteria before making a decision.
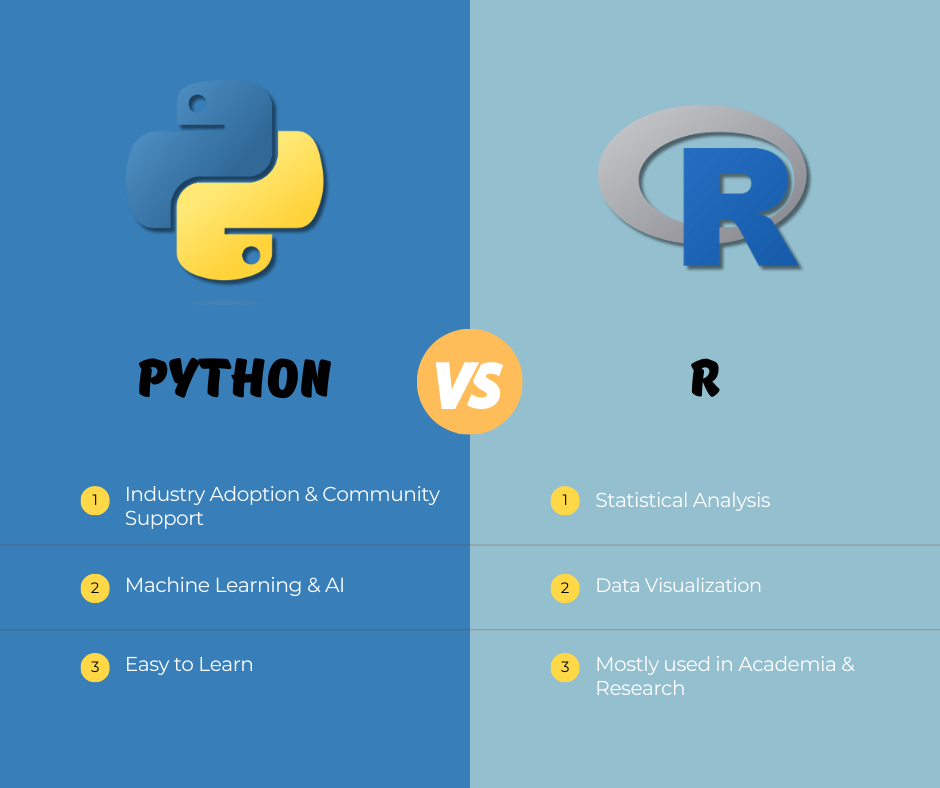
In this article, we will compare Python and R based on five important criteria:
- Data manipulation and statistical analysis.
- Machine Learning and AI-related capabilities.
- Data Visualization and Presentation
- Industry Adoption and Community Support.
- Ease of Use and Learning Curve
By understanding the pros and cons of each language, data analysts can make an informed decision to select the most suitable language for their needs.
1. Data Manipulation & Statistical Analysis
Python provides powerful libraries for Data Handling such as Pandas and NumPy, which are widely used for data manipulation and statistical analysis. These libraries offer comprehensive functionalities for handling large datasets, cleaning data, and conducting exploratory data analysis.
While Python offers excellent support for data manipulation, it lacks some of the specialized statistical analysis capabilities provided by R. Analysts may need to rely on additional libraries or packages to perform advanced statistical tasks. For example, to perform a simple chi-squared analysis in Python, you might have to write several lines of code while in R you can perform the same analysis in one go.

R is renowned for its exceptional statistical capabilities. It comes bundled with numerous packages like dplyr and tidyr (part of the “tidyverse”), which facilitate effortless data manipulation and cleaning. Along with dplyr and tidyr, the tidyverse library contains several other very powerful packages which enable next-level Data Visualization, String Manipulation, and Handling Date Time values. In addition to that, R’s built-in functions for statistical analysis make it a favored choice for statisticians and researchers.
Compared to Python, R may have a steeper learning curve for those who are new to programming. Additionally, R might not be as efficient when dealing with large datasets or when data manipulation tasks involve complex operations.
Therefore, it is safe to say that R and Python kind of go neck to neck in this department.
2. Machine Learning and AI-Related Capabilities
Python’s machine learning and AI ecosystem is highly robust and diverse. Libraries like scikit-learn and TensorFlow provide extensive support for implementing various machine learning algorithms and building sophisticated AI models. Python’s flexibility and ease of integration with other tools make it a go-to language for AI and machine learning projects.

While Python has a vast array of machine learning libraries, it might not have the same depth and breadth of statistical modeling techniques as R. Some complex statistical models and algorithms might require additional effort to implement in Python.
R has a rich collection of packages specifically designed for statistical modeling and machine learning. R’s strong focus on statistical techniques makes it an attractive choice for data analysts working in research-oriented domains.
R’s machine learning ecosystem might not be as extensive or diverse as Python’s. Certain cutting-edge AI algorithms or frameworks might have limited support in R, requiring users to resort to Python or other languages for specific tasks.
So, if you are a Machine Learning Enthusiast or your day-to-day tasks are more oriented towards Predictive Modelling and AI, Python would be more suitable for you.
3. Data Visualization and Presentation
Python provides versatile libraries like Matplotlib and Seaborn, which enable the creation of high-quality visualizations. These libraries offer a wide range of customization options, making it easy to generate visually appealing plots and charts. Python’s integration with web frameworks and interactive visualization libraries like Plotly further enhances its data visualization capabilities.
Compared to R, Python’s data visualization libraries may have a steeper learning curve, especially for individuals new to programming. Additionally, Python’s default plotting functionalities might require more code and effort to achieve similar results as R. And from my own personal experience, I know that this can become quite hectic at times.

R boasts exceptional data visualization capabilities through libraries like ggplot2 and plotly. R’s syntax and dedicated visualization packages like ggplot2 make it effortless to create elegant and presentation-ready visualizations. The vast number of pre-designed visualization themes and templates available in R further contribute to its popularity among data analysts.
While R’s data visualization libraries are powerful, they may have limitations in terms of customization options when compared to Python. But in my personal view, I think the data visualization functionality of R is more than enough for most of the analytical tasks.
4. Industry Adoption and Community Support
Python has gained immense popularity in the industry, making it one of the most widely adopted programming languages for data analysis. Its versatility and extensive library ecosystem have led to widespread adoption in various domains, including tech, finance, and healthcare. Python’s popularity ensures a vast community of users, providing access to numerous resources, tutorials, and forums for support.
Python’s popularity and extensive library ecosystem can sometimes lead to fragmentation, with multiple libraries addressing similar tasks. This can make it challenging for newcomers to choose the right libraries or packages for their specific requirements.

R has a strong foothold in academia and research, making it prevalent in fields like statistics, social sciences, and bioinformatics. R’s user community is highly active and supportive, offering a plethora of specialized packages and forums for assistance. The popularity of R in specific domains ensures that users can find tailored solutions for their analytical needs.
While R enjoys significant adoption in certain sectors, its industry presence might not be as widespread as Python’s. Some organizations or industries may prefer Python due to its broader applications and integration with other tools and platforms.
5. Ease of Use and Learning Curve
Python is often praised for its simplicity and readability, making it a popular choice for beginners. Its English-like syntax and comprehensive documentation contribute to its ease of use. Additionally, Python’s clean and intuitive code structure allows data analysts to write concise scripts, increasing productivity and reducing development time.
Despite its beginner-friendly nature, Python’s wide range of libraries can be overwhelming for newcomers. Choosing the right libraries and understanding their usage might require additional effort. Furthermore, Python’s focus on code readability can sometimes result in reduced performance compared to languages like R.

R’s syntax and design prioritize statistical analysis, making it intuitive for users with a statistical background. Its interactive console and built-in functions allow for rapid exploration and analysis of data. R’s data manipulation and statistical operations are often performed using concise and expressive code, enhancing productivity.
R’s learning curve can be steep for individuals without a background in programming or statistics. Its syntax, which differs from conventional programming languages, might pose a challenge to beginners. Additionally, R’s focus on statistical techniques might make it less suitable for tasks beyond the realm of data analysis.
Conclusion
In conclusion, the choice between Python and R as the programming language for data analysis depends on various factors. Python excels in data manipulation, machine learning, and industry adoption, offering a vast ecosystem of libraries and tools. On the other hand, R shines in statistical analysis, data visualization, and community support, making it a preferred choice for researchers and statisticians.
Considering the five criteria outlined in this article, data analysts should assess their specific requirements and priorities before making a decision. Python’s versatility, industry support, and ease of use make it an excellent choice for those seeking a broad range of data analysis applications. However, if statistical analysis, specialized visualization, and a strong research-oriented community are paramount, R may be the preferred language.
Ultimately, the best programming language for you as a data analyst in 2023 would be the one that aligns with your goals, matches the requirements of your domain, and allows you to efficiently analyze and derive insights from data. Whichever language you choose, remember that continuous learning and adapting to new tools and techniques will be essential in an evolving field like data analysis.