Most of the new-comers to the field of statistics have a very common question. That is; What is the software should I chose to do my Statistical works?
When it comes to software, each one has its own advantages and disadvantages. In this post, I will be explaining about each of these tools and let you decide what’s best for you.
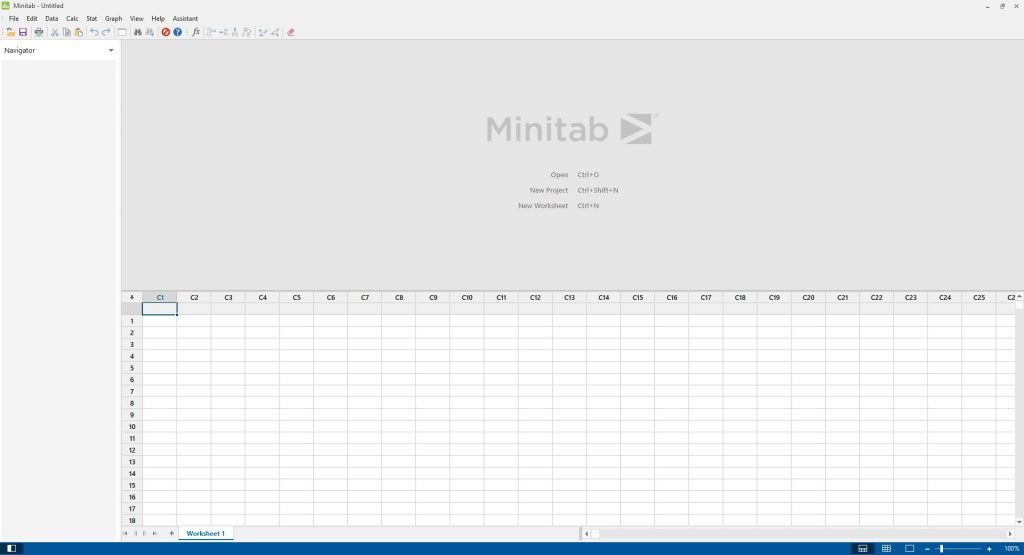
Minitab
Minitab is an Excel-like software with a user-friendly GUI (Graphical User Interface). It falls under the category of ‘Menu-Driven Software’ and is best for basic statistical analysis and educational purposes. You can conduct statistical tests very quickly with the use of the Graphical User Interface. Minitab can be used to analyze your research data, conduct hypothesis testing, regression analysis and so on. Not only that, you can also do Text Mining and Run Machine Learning Algorithms on the latest versions of Minitab. Also, it is very easy to learn. This is a major factor when it comes to beginners. Since it is more like an Office Package software one can learn it very fast so that he/she can pay more attention towards Statistics rather than learning the software. Present-day, Minitab is mostly used for teaching purposes since it is very easy to test and understand statistical concepts using Minitab.

Minitab also comes with a comprehensive help package. You can visit https://support.minitab.com/en-us/minitab/19/?SID=0 to find support for Minitab. Even a beginner can learn it just by referring to that help page. Minitab BLOG is also a great place to look for help and extra knowledge. It contains numerous high-quality blog posts on Minitab as well as on Statistics.
Minitab is not used in the industry. So it’s always wise to get along with another Statistical Package if you are planning to enter in to the industry.
In conclusion, Minitab is an easy to learn and easy to use software ideal for Beginner Statisticians and Academics. If your focus shifts from Statistics to Machine Learning or Data Science, then you might have to get used to a Programming Language like R or Python. But for the Statistical Analysis, Minitab is your convenient partner!
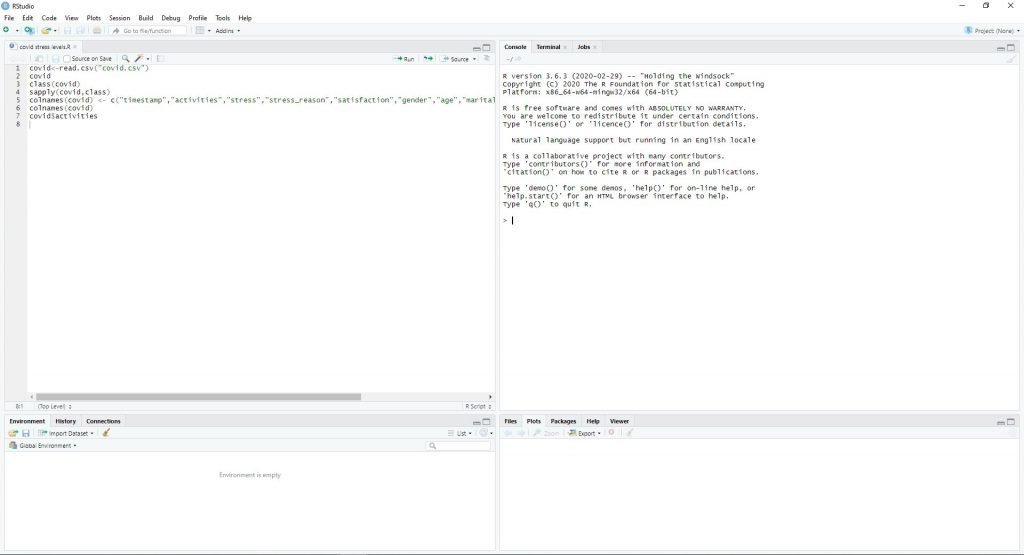
R
R is a Statistical Programming package. It is totally free for use and can be downloaded from here. Since it’s free, students can download it and use it without any hit on their pockets.
R is basically like a programming language. Therefore those who are with programming background will find it very easy to learn. Even if you don’t have programming knowledge, you can learn it within a few days of work. On the other hand, R is very popular all around the world and its popularity continues to grow. As a result R continues to grow rapidly hence making it very powerful.
R studio is like Netbeans for R. R studio makes your life so much easier. It is very user friendly tool and it makes R Programming really interesting.

If you are eyeing for a Statistics related job opportunity, learning R will always come handy. Surveys have proven that those who are fluent with R gets paid highly.
R is a very powerful tool. You can do basic statistical analysis as well as implement complex machine learning algorithms using R. It comes with several libraries which allows you to do high-end data visualizations, text-mining, sentiment analysis and so on. For example, the package dplyr increases the power of R exponentially. It is a package which helps you to data manipulation without any hassle. Similarly, there are a large number of packages that enhances the functionality of R. This is one thing you don’t get from a software like Minitab.
But, when compared with Python, R has relatively low usage in the industry. R is widely used in the Medical and Research areas. Whereas Python is widely used in IT and other business areas.
Conclusively, if you are an energetic Statistician with a drive to push your limits, R is your go-to partner. If you are fluent with Statistics and aspire to be a Data Scientist one day, then you should definitely learn R. It will not let you down and will only expand your horizons.
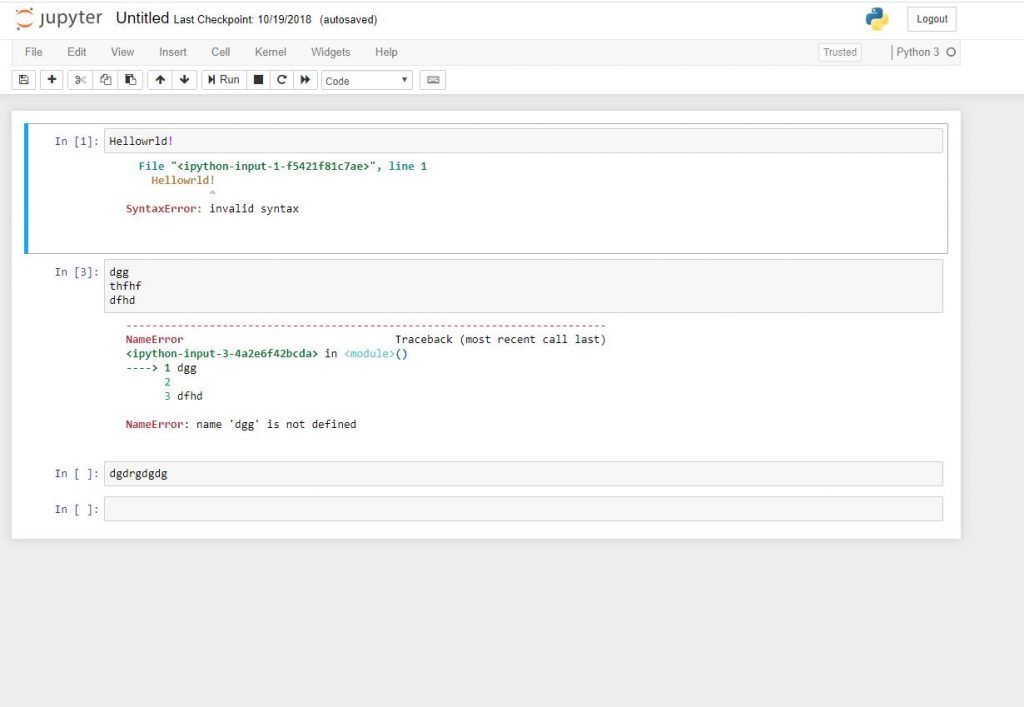
Python
Python is an object-oriented high level general purpose programming language. In fact it is one of the highest trending languages right now. Python can do almost all the tasks that R does. Most importantly, python can execute far more complex tasks. Python is capable of data wrangling, feature selection, web scraping, image analysis, machine learning and so on.

Since it is a programming language, the learning curve is bit steep but the effort is totally worth it. Python is ideal for programmers who are interested in statistical analysis or people who want to pursue in Data Science. Its comparatively easy to execute complex tasks in Python than in R. There are very useful libraries like NumPy, Pandas, Sci-Kit and Seaborn which makes easy to do Data Science related tasks.
I would say Python is the No. 01 choice for a Data Scientist considering the tools provided.
Conclusion
So in conclusion, If you are a Statistician and not expecting to shift your domain to machine learning or data science soon, Minitab is your partner. You can do your statistical analysis hassle-free and most importantly you don’t need any coding knowledge at all!
R is your tool if you are a Statistician who is interested in more complex tasks. Since R is specialized for Statistical Programming, it is much easier to do Statistical tasks in R. And if you are in the Academia or the Health Sector, then you should definitely get familiarized with R.
If you aspire to be a Data Scientist or if you are a programmer looking to play with Statistics and you are looking for Job Security, then Python is your savior. In fact, learning such a powerful language will reap huge benefits for you in the long run. Python is very popular and it is constantly evolving at a rapid phase. Most of the Data Science jobs require Python as a compulsory skill.
On final note, Minitab, R and Python are all tools which makes your work easier. Choosing which tool to use depends 100% on your requirement and preference. I tried my best in this post to make things easier by giving you a bird’s eye view of these 3 tools. Hope I succeeded and do share this on social media and comment your suggestions!


Hello.
I’m a junior Stastician, inspired to learn python. How can you help me.
T
Thank you.
Hi nice to know you. You can start by watching python tutorials on youtube. Learn principals first. Then it will be easy to do complex tasks. Please follow the below link for a very good python tutorial. It helped me a lot.
https://www.youtube.com/watch?v=_uQrJ0TkZlc
Hello,
I am a reseacher and I usually use SPSS for data analysis. But I also want to learn about R. How can you help me?
Thank you.
Hello,
I am a reseacher and I generally use SPSS for data analysis. But I want to learn about R.
How can you help me?
Thank you
hi thanks for visiting our website. we have a seperate post for R tutorial sources.
https://datasciencelk.com/r-tutorials/