Introduction
Most of you have heard about the term Time Series Analysis if you have learned Statistics as a subject anywhere. We at datasciencelk, are bringing you a series of posts about Time Series Analysis in detail.
So what actually is Time Series Analysis?
Time Series Analysis is basically the study and forecasting of time series data using statistical analytical methods.
What is time series data?
Time series data are series of data points collected sequentially in time, where in most cases the time intervals are regular intervals.
Important feature with time series is that successive observations are usually not independent.
Therefore, when successive observations are dependent, future values can be predicted from past observations. For an example, we can predict the number of road accidents that will happen in the state of Chicago in 2021 based on the data in 2020, 2019 and 2018.
Hence, Time Series Analysis is concerned with techniques for the analysis of this dependence.
Examples for Time Series in Real World
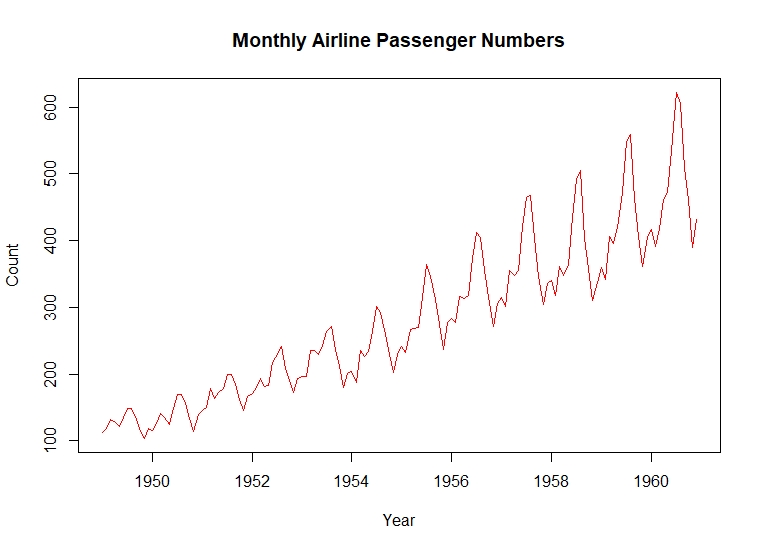
Shown above is a plot generated from time series data. Here, the variable of interest is the “Number of Passengers in this particular airline within a month”. In this scenario, time intervals are months. That means, there is one month gap between two data points.
Uses of Time Series Analysis and Forecasting
Time series analysis and forecasting is used in a wide spectrum of industries. Analysts use time series models to forecast stock prices, predict revenues, growth rates and so on.
Time Series models are used widely in economics and business. It helps to recognize patterns and make decisions based on that patterns.
Weather prediction and earthquake prediction are also some important works done using time series models.
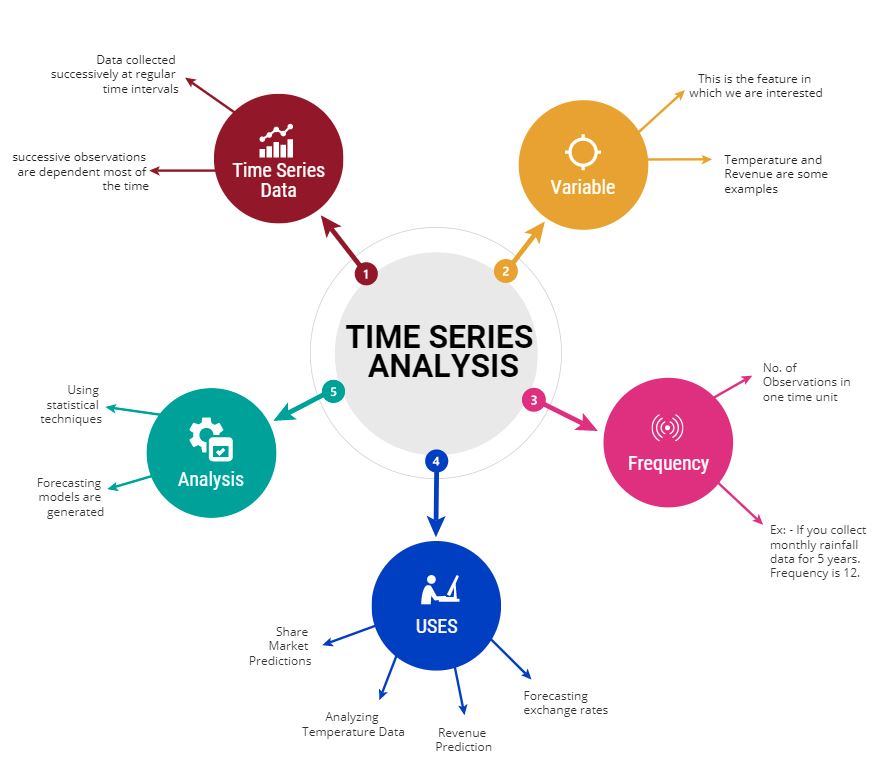
Mind Map
Types of Time Series
- Continuous Time Series
- Discrete Time Series
Continuous Time Series
A time series is said to be continuous when observations are made continuously in time.
The term ‘continuous’ is used for these type of time series even when the measured variable can only take a discrete set of values.
Think about a binary process where the outcomes can only be 0 or 1. It is clear that this variable is discrete. But this data can be recorded continuously in time.
Ex : Electric Signal and Voltage, Binary Processes
Discrete Time Series
A time series is said to be discrete when observations are taken only at specific times, usually equal spaced, even the measured variable is continuous.
Ex : Annual Rainfall, Monthly Airline Passenger Data
A continuous variable is a variable whose value is obtained by measuring and it can take any value between two values. Temperature and Rainfall are good examples for continuous variables.
Cross Sectional Data and Time Series Data
| Cross Sectional Data | Time Series Data |
| Data Collected by observing many subjects such as individuals, objects, countries at the same point of time. | Set of observations collected at usually discrete and equally spaced time intervals on the same subject |
Why do we analyze Time Series?
The answer to this question can be summed up in two main points.
- To identify the underlying patterns represented by the time series data.
- To forecast the future values of the time series variables.
Time Series Plot
Time Series Plot is a graphical representation of the relationship between time and the time series variable. Here, time is on the horizontal (x) axis and time series values are on the vertical (-y) axis.
Time Series plot shows trends, seasonal behaviors, and other systematic features of the data.
These features needs to be identified so thet can be incorporated into the statistical model.
Also, time series plots can be used to detect any outliers in the data set.
Conclusion
In this post, we discussed what is meant by a time series, why do we need it and other fundamentals related to time series analysis.
In the next post, we will explain the Decomposition Method of Time Series Analysis.