Normal Distribution is the most important probability distribution in Probability and Statistics.
In our day to day lives, we come across many examples that resembles a normal distribution. Some examples are Heights, Weights, measurements errors in scientific experiments, measurements of intelligence and aptitude, scores on various tests, and numerous economic measures and indicators.
The normal probability distribution is well known for the Bell Shaped Curve. In fact, this bell shaped curve is how we identify a Normal Distribution at first.
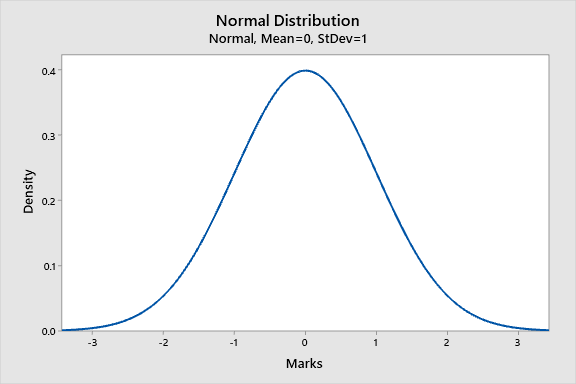
Area under the curve is always equal to 1
Definition
A continous random variable X is said to have a normal distribution with parameters μ and σ , if the probability density function of X is
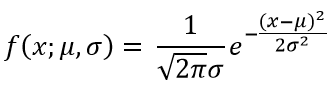
Here -∞ < x < ∞ and -∞ < μ < ∞
Here e is the base of natural logarithm system. It’s value is approximately 2.718.
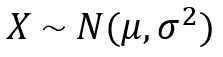
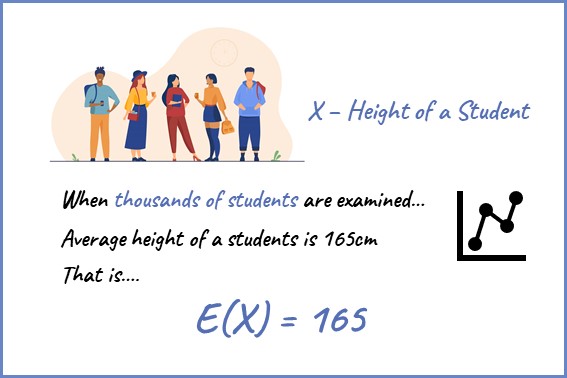
We can represent our random variable X as follows;
Empirical Rule
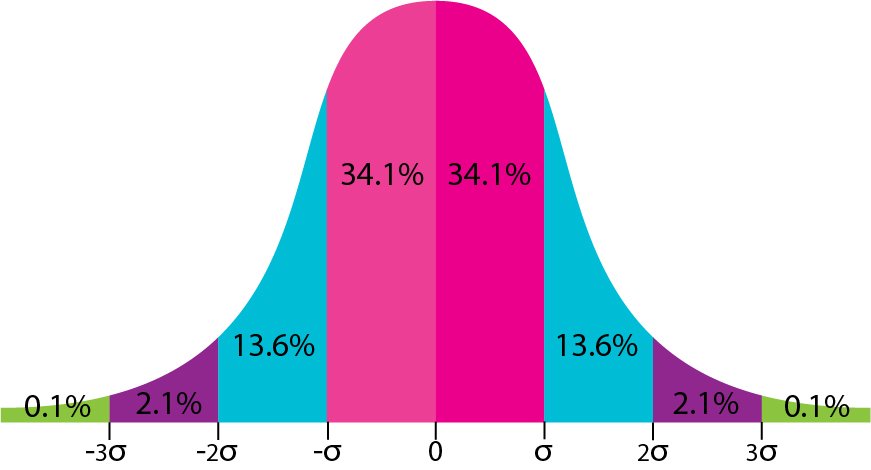
Statisticians have established an empirical rule for the Normal Distribution as a result of hundreds and thousands of experiments done over the years.
According to the Empirical Rule, 68.2% of data lies within 1 standard deviation from the mean
95% of the data lies within 2 standard deviations from the mean
99.7% of the data lies within 3 standard deviations from the mean
Complex Calculation Problem…
To calculate probabilities say P(a≤ X ≤b), we need to evaluate the following integral;
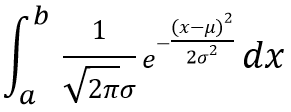
It is obvious that the calculation of above integral is somewhat complex. Therefore statisticians have invented a simpler method to calculate probabilities associated with the Normal Distribution. By setting μ = 0 and σ = 1 they defined a new distribution called Standard Normal Distribution. There are tables that contain calculated probabilities (μ = 0 and σ = 1) after evaluating the above integral for certain values of a and b.
Standard Normal Distribution
Standard Normal Distribution is the Normal Distribution with 0 mean and 1 as the standard deviation.
A random variable following Standard Normal Distribution is called as a “Standard Normal Random Variable”. It is represented by Z. Which is why in some texts it is referred as the “Z Distribution”.
The pdf of Z is ;


Let’s solve a problem to get more hands-on experience about this
Example Problem
Finding P(Z ≤ 1.25)
Here we have to find the area to the left of Z. The probability values are tabulated in the table here. You can find this probability at the intersection of the row marked 1.2 and the column marked 0.05. You will find the number 0.8944. Therefore, P(Z ≤ 1.25) = 0.8944
Z – Score
We call a value on the standard normal distribution as the z-score.
Z score is defined in terms of the no. of standard deviations from the mean.
For an example, z-score of 1 means that the value is one standard deviation away from the mean.
Accordingly, mean has a z-score of 0.
Standardization
Sometimes, we need to take data from two different distributions with different means and standard deviations to conduct analysis.
An example is the comparison of price of cars and price of helicopters. Very clearly these two distributions are light years apart! Right? So how can I compare a price of a car to price of a helicopter???
This is where the concept of Standardization comes into play. We need to convert our data into z scores.
Z score formula is as follows;
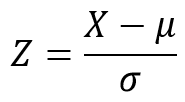

good
Thanks a lot. Please tell me if you want tutorials on other statistics topics
thank you
You are welcome!