Apple’s worst ever design: how is this even possible?
Lorem ipsum dolor sit amet, consectetur adipisicing elit, sed do eiusmod tempor incididunt ut labore et dolore magna aliqua.
Apple’s worst ever design: how is this even possible? Read More »
Lorem ipsum dolor sit amet, consectetur adipisicing elit, sed do eiusmod tempor incididunt ut labore et dolore magna aliqua.
Apple’s worst ever design: how is this even possible? Read More »
The classical method of time series is done by decomposing a time series into trend, seasonal, cyclic and irregular components. What is decomposing? The meaning of the word “decomposing” in Mathematics is breaking something into parts, that together are the same as the original. For example, we can decompose 664 like this; 664 –> 600
Classical Method of Time Series Analysis Read More »
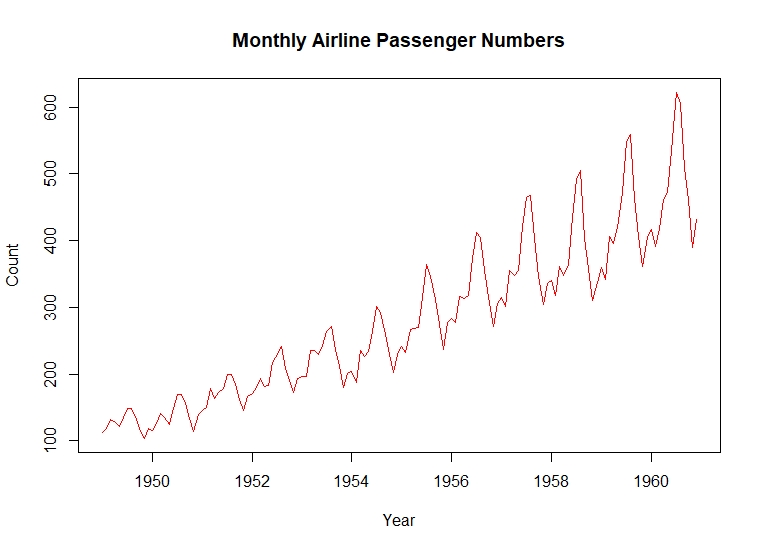
Introduction Most of you have heard about the term Time Series Analysis if you have learned Statistics as a subject anywhere. We at datasciencelk, are bringing you a series of posts about Time Series Analysis in detail. So what actually is Time Series Analysis? Time Series Analysis is basically the study and forecasting of time
Time Series Analysis Read More »

Minitab is ideal for Statistical Analysis. R is great for complex statistical analysis. Python is ideal for Machine Learning and Data Science
Which software to use, Minitab, R or Python? Read More »
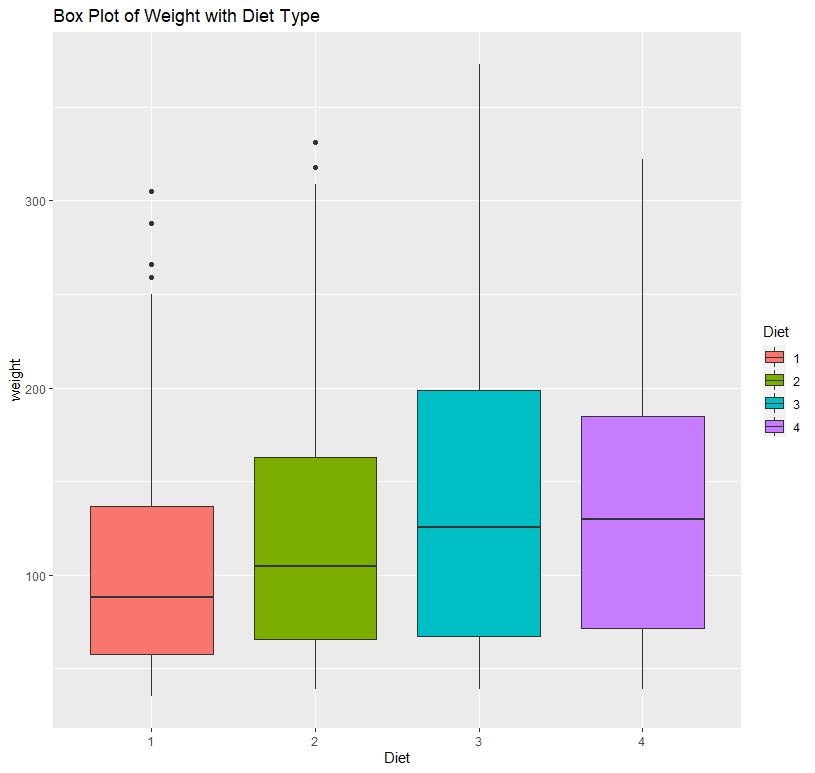
Box Plots are used to get a good visual idea about the distribution of data and spot outliers.
Creating Box Plots in R ggplot2 Read More »
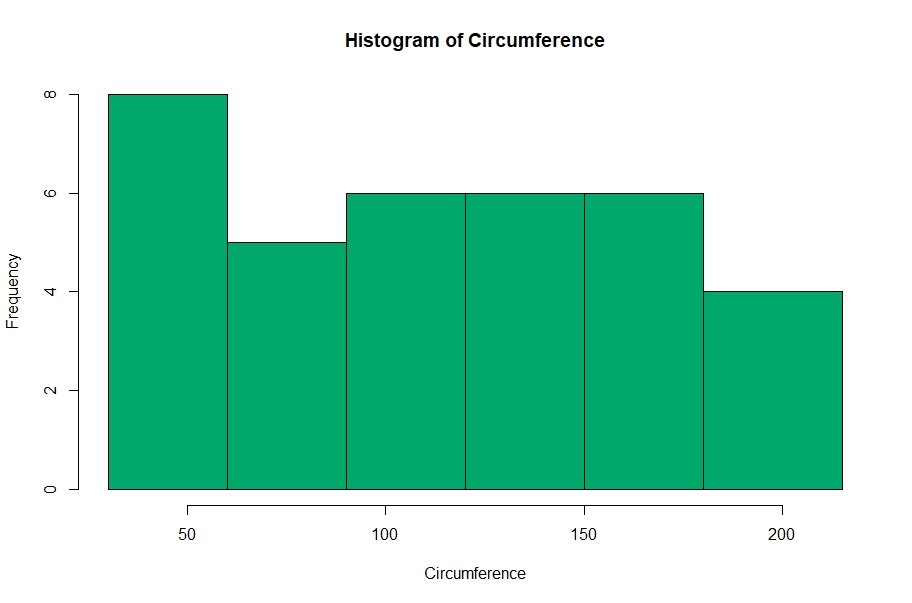
We can use histograms in R to visualize continuous variables. In a histogram, the area of each column is proportional to the frequency.
How to make a Histogram with R Read More »
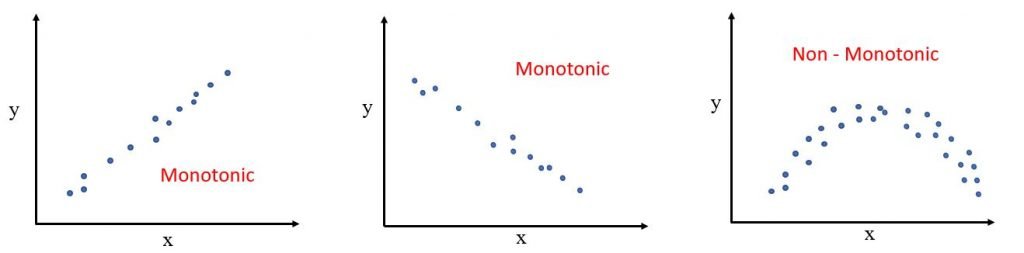
Introduction The correlation coefficient is used to measure the strength of the relationship between two variables. There are several types of correlation coefficients; Pearson Correlation Coefficient Spearman Rank Correlation Coefficient Kendall Rank Correlation Coefficient Pearson Correlation Coefficient Generally, when we say correlation coefficient, we actually mean Pearson’s Correlation Coefficient. This is used to measure the
Correlation Coefficient Interpretation Read More »
Poisson Distribution outputs the probability of a sequence of events happening in a fixed time interval.
Poisson Distribution Explained Read More »

Word cloud is a data visualization technique. It is basically an image consisting of words.
Creating a word cloud using R Read More »