Introduction
Statistical Data Analysis or simply put “Data Analysis” is very common term these days. But what does this really mean? And most importantly, why should we do that?
Well, as you all know, “Data is the new Oil”

To get proper use of oil, we need to mine it from underground and purify it according to the requirement. When it comes to data, the story is the same. We have to collect the data, clean it or “purify” it and then use it to make informed decisions.
There was a time when the countries with oil were untouchable as they were always ahead of the herd since they had the one thing that made the world move.
Well, the times have changed now. In this decade, anyone who possesses quality data is untouchable. Whether it can be a business entity, a hospital, a person, or even a government., without data you are nothing.
This is why data analysis plays such a big role in decision-making. In fact, decision-making without data to back is like sleepwalking!
Having good data is not enough, one should know how to reap the benefits of data more efficiently and quickly so that the person who possesses data gets the benefit. This is why there are so many techniques and paths for data analysis. Each case is different and the requirements vary with time.
Therefore, having a very good grip on data analysis is critical in this new age.
Data Analysis Life Cycle
To make things simple, here we have introduced the concept of “Data Analysis Life Cycle”.
This basically consists of 3 stages named Problem Identification, Data Preparation, Modelling, and Conclusion.
Problem Identification
Data analysis always begins with a problem. If it’s a business entity, then the problem might be the lack of sales or the inefficiency of its employees. Whatever the problem is, it should be identified clearly along with the related variables. Then data should be gathered correctly. Questionnaires, Interviews, and Past Records are a few ways to gather data.
Data Preperation
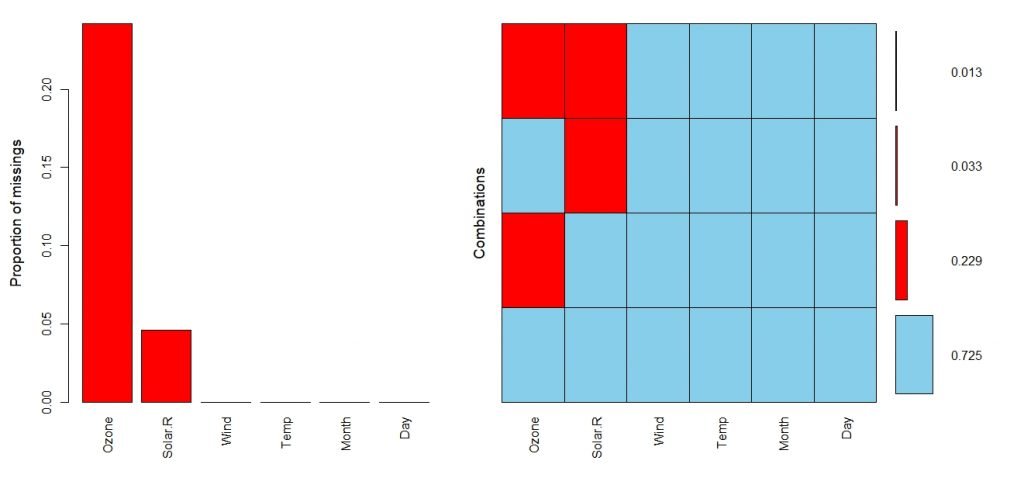
Once the data is collected, data should be cleaned. That is, the dataset should be checked for missing values, outliers, etc. If there are missing values or outliers, then the decisions should be made whether to get rid of those data points or impute them. This mainly depends on the importance of missing data points to your problem.
Then it is better to do an Exploratory Data Analysis or EDA. EDA is done to get an overview of the dataset. Mean, Mode and Variation of Data Points are some of the statistics that you can derive from and Exploratory Data Analysis.
Modeling and Conclusion
Okay, here comes the good part! It’s the model-building time! Statistics is all about modeling data. Finding the correct model that best suits your data is the goal. To do this, sometimes basic statistical concepts can be used, and sometimes sophisticated approaches like machine learning will have to be used.
Based on the data model, conclusions can be made and these conclusions clear the path to make informed decisions. This way, businesses can reduce mistakes and increase efficiency. Medical Experts can decide on the most effective treatment methods, and so on.
Conclusion
By now, you may have understood the importance of Data Analysis and why it should be done.
In the upcoming posts, we are planning to bring you a detailed post series on data analysis using R Programming. If interested, please drop in a comment and show your support!

