Creating Box Plots in R ggplot2
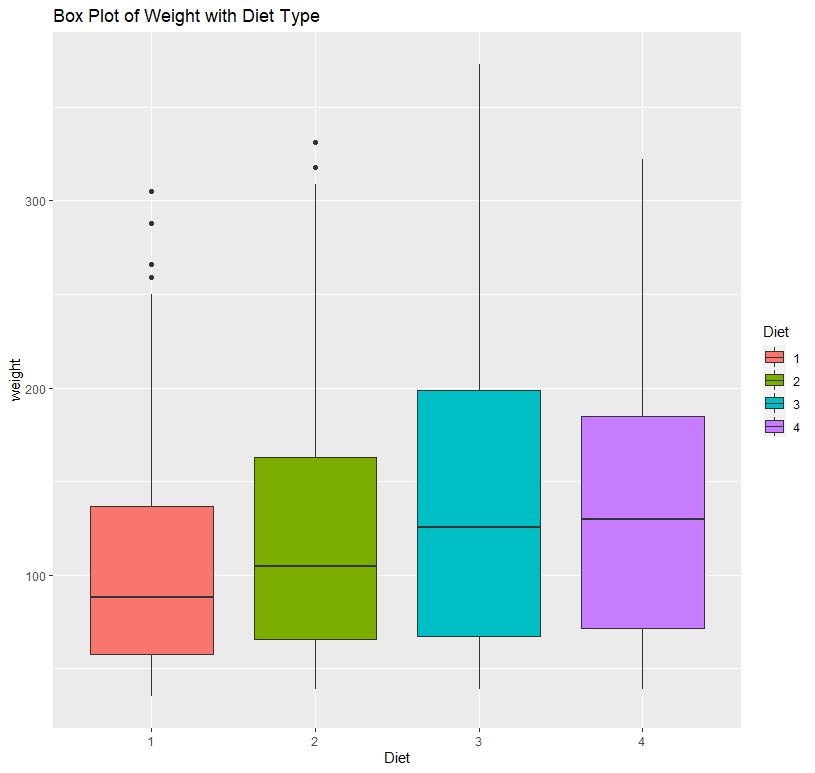
Box Plots are used to get a good visual idea about the distribution of data and spot outliers.
Creating Box Plots in R ggplot2 Read More »
Box Plots are used to get a good visual idea about the distribution of data and spot outliers.
Creating Box Plots in R ggplot2 Read More »